Smart Scale Metrics Explained: Muscle Mass, Visceral Fat, BMR
Smart Scale Metrics Explained: What Muscle Mass, Visceral Fat, and BMR Actually Tell You
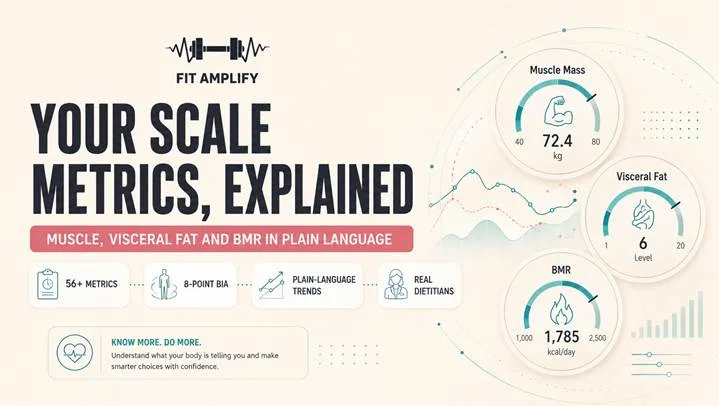
Step on a smart scale and it hands back a wall of numbers. Weight you understand. But muscle mass, visceral fat, BMR, metabolic age, body water? Most people glance at them once and go back to staring at the single number they already knew. That is a shame, because a few of those metrics tell you far more about your health than weight ever will. This guide explains what muscle mass, visceral fat, and basal metabolic rate actually mean, roughly what a healthy reading looks like, and, most usefully, what to do with each one.
Key takeaways
· Weight is one number. Muscle mass, visceral fat, and BMR explain what that weight is made of and how your metabolism behaves.
· Muscle (lean) mass is your metabolic engine. More of it tends to raise the calories you burn at rest, and it is worth protecting as you age.
· Visceral fat is the fat around your organs. It is only about 10% of body fat but carries most of the health risk, and it responds well to activity.
· BMR is the energy your body uses at rest, roughly 60 to 75% of the calories you burn in a day. It is the baseline your eating and training sit on top of.
· A smart scale estimates these with bioelectrical impedance, so read the weekly trend, not a single reading, and treat visceral fat as a rating rather than a lab measure.
· The numbers are most useful when they lead to one action, ideally with a plan or a real expert behind them.
In this article
· Why your scale gives you more than a weight
· Muscle mass: your metabolic engine
· Visceral fat: the fat that actually matters
· BMR: your body's baseline burn
· The metrics at a glance
· How the metrics work together
· What to actually do with each number
· The honest limits of a smart-scale reading
· Where FitAmplify fits
· Frequently asked questions
Why your scale gives you more than a weight
Weight on its own is a blunt instrument. It tells you how much you are, not what you are made of. Two people can weigh exactly the same and be completely different inside, one carrying more muscle and less fat, the other the reverse, with very different health outlooks. That is the whole reason body-composition scales exist. They use a technology called bioelectrical impedance analysis, or BIA, which sends a tiny, safe electrical current through your body and measures the resistance. Because muscle, fat, and water each conduct that current differently, the scale can estimate how your weight breaks down.
The result is a set of metrics that answer better questions than the bathroom scale ever could. Not just how heavy am I, but am I gaining muscle or losing it, is my fat the risky kind, and how much energy does my body actually need. Three of those readings do most of the heavy lifting: muscle mass, visceral fat, and BMR. Understand those three and the rest of the dashboard starts to make sense.
Metric | In one line | The one move |
Muscle mass | Your metabolic engine. More of it burns more at rest | Protect and build it with strength work |
Visceral fat | The risky fat around your organs | Bring it down with activity and better eating |
BMR | The calories you burn at rest, your baseline | Use it to set a realistic intake |
At a glance. General wellness guidance, not a prescription. Details below.
Muscle mass: your metabolic engine
Muscle mass, sometimes labelled lean mass or skeletal muscle mass, is the amount of muscle tissue your body carries. It is one of the readings a smart scale estimates relatively well, because muscle holds a lot of water and conducts the current predictably.
Why it matters goes well beyond the gym. Muscle is metabolically active tissue, which means it burns energy even while you sit still. That is why it is often called your metabolic engine. Building even a small amount of muscle can nudge up the calories you burn at rest. One strength-training resource notes that adding just two to four pounds of muscle can raise resting metabolism by roughly 7 to 8%, which is worth around 90 to 110 extra calories a day. Muscle also supports your strength, your balance, your blood-sugar handling, and how well you move as you get older.
That last point is the quiet one. Adults gradually lose muscle as they age unless they actively train to keep it, and the loss speeds up in later decades. Losing muscle slows your metabolism and makes everyday life harder, which is exactly why watching this number over time is worth more than watching weight. A scale weight that stays flat while your muscle mass climbs is a genuine win, and it is one the bathroom scale would have hidden from you entirely.
What to look for is direction, not a magic number. Healthy muscle mass varies enormously by height, sex, and training history, so the useful question is not whether you match a chart. It is whether your own trend is holding steady or rising over the weeks and months, especially while you are dieting or getting older, when muscle is most at risk.
Visceral fat: the fat that actually matters
Not all body fat is equal, and visceral fat is the reason. Most of the fat you carry is subcutaneous, the soft layer just under your skin that you can pinch. Visceral fat is different. It sits deep in your abdomen, wrapped around your organs, and it behaves in a far less friendly way.
According to Harvard Health, only about 10% of body fat is visceral, with the other 90% subcutaneous. But that small slice carries most of the risk. Visceral fat is biologically active, meaning it releases inflammatory molecules and other compounds that can raise blood pressure and drive low-grade inflammation. Research links higher visceral fat to a meaningfully greater risk of heart disease and other chronic conditions, and that risk can be raised even in people whose overall weight looks perfectly normal.
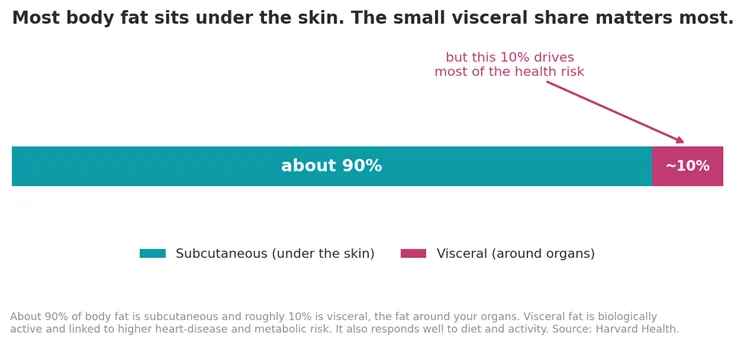
Most body fat is subcutaneous, but the small visceral share drives most of the risk. Source: Harvard Health.
There is good news buried in the biology. Because visceral fat is more readily broken down, it tends to respond well to regular activity and better eating, often before the bathroom scale shows much at all. So a falling visceral-fat reading can be an early and encouraging signal that your habits are working, even during a week when the weight has not budged.
One honest caveat belongs here. A smart scale does not measure visceral fat directly the way a CT or MRI scan would. It gives you a visceral-fat rating, an estimate on a simple scale. Treat that rating as a trend to watch rather than a precise diagnosis, and if it sits high and stays there, that is a good reason to talk with a healthcare professional.
BMR: your body's baseline burn
BMR stands for basal metabolic rate, and it is one of the most practical numbers on the whole dashboard. It is the amount of energy your body uses just to keep you alive at complete rest: breathing, pumping blood, and running your brain and organs. In plain terms, it is roughly the calories you would burn if you stayed in bed all day and did nothing.
That matters more than it sounds, because BMR is the biggest single chunk of the energy you burn. Resting metabolism accounts for roughly 60 to 75% of your total daily energy expenditure, with physical activity and the work of digesting food making up the rest.
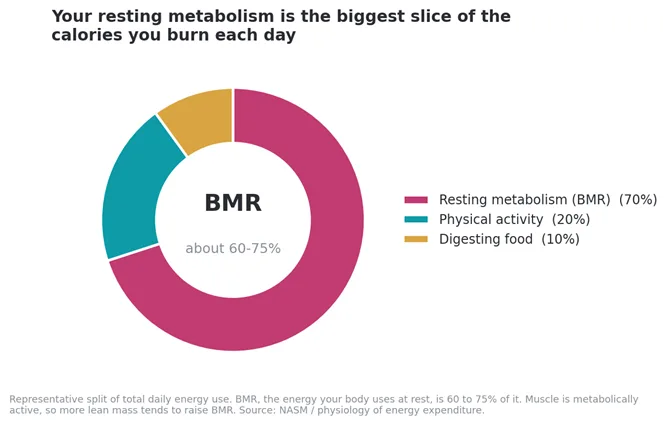
Your resting metabolism is the largest share of the calories you burn each day. Source: NASM / physiology.
Your eating and training sit on top of that baseline. Knowing your rough BMR gives you a realistic starting point for how much fuel your body needs, rather than guessing from a generic calorie chart. Scales estimate it from your weight, height, age, sex, and body composition, often using a well-known formula such as the Mifflin-St Jeor equation.
Here is where the three metrics connect. Because muscle is metabolically active, more muscle mass tends to raise your BMR, while losing muscle lowers it. That is one reason crash diets can backfire. Lose muscle along with fat, and you quietly shrink the very engine that burns your calories, which makes the weight easier to regain later. Watching BMR alongside muscle mass tells you whether your metabolism is holding up as your weight changes, not just whether the number on the scale is falling.
The metrics at a glance
Here is the plain-language version of the key readings, including a few supporting metrics you will see on the same screen and how to read each one.
Metric | What it actually is | Why it matters | How to read it |
Muscle (lean) mass | Muscle tissue, estimated from body water | Burns energy at rest; supports strength and healthy ageing | Watch the weekly trend; steady or rising is good |
Visceral fat | Fat around your abdominal organs | About 10% of body fat but most of the health risk | A rating to lower over time, not a daily number |
BMR | Energy used at complete rest | 60 to 75% of the calories you burn daily; your baseline | A realistic starting point for intake |
Body fat % | The share of your weight that is fat | Context that weight alone cannot give | Compare to your own healthy range, by age and sex |
Body water | Total water in your body | Explains daily weight swings and hydration | Expect it to fluctuate day to day |
Metabolic age | Your BMR compared with population averages | A motivational summary, not a diagnosis | A nudge to read loosely, not literally |
General meanings and how to read each metric; sources in the References. All are BIA estimates, not lab measures.
How the metrics work together
The real value shows up when you stop reading these numbers in isolation, because together they tell a story. Say the scale weight has not moved in a month. On its own, that is discouraging. But if muscle mass is up, visceral fat is down, and BMR is holding steady, that flat weight is actually excellent news. You have recomposed, trading fat for muscle while keeping your metabolism intact. The bathroom scale would have called that a failed month and quietly talked you out of a plan that was working.
Now take the opposite case, a rapid drop in weight. Satisfying on the scale, but if muscle mass fell and BMR dropped with it, you may have lost the very tissue that keeps your metabolism running, which tends to make the weight easier to regain. Reading muscle, fat, and BMR together turns a single confusing number into a clear picture of what is actually changing, and whether it is the change you were hoping for.
What to actually do with each number
Metrics are only useful if they change something you do. Here is a general, non-prescriptive starting point for each one, the kind of first lever a coach might reach for before tailoring it to you.
Metric heading the wrong way | What it may mean | A sensible first step |
Muscle mass falling | You may be losing lean tissue | Add resistance training and enough protein |
Visceral fat rising | More of the risky abdominal fat | Increase daily activity; ease off added sugar and alcohol |
BMR dropping | Your metabolism may be slowing | Protect muscle and avoid very aggressive crash diets |
Body fat % rising | Fat gain is outpacing muscle | Review the balance of intake and training |
General guidance only, not medical or dietary advice. A qualified professional can tailor any of this to you.
None of these are prescriptions. They are the obvious first levers, and the right specific move depends on your body, your history, and your goals. That is exactly where a real dietitian or coach earns their keep, by reading your particular numbers and telling you which lever to pull first.
The honest limits of a smart-scale reading
A quick reality check, because trust comes from honesty. A smart scale estimates these metrics using bioelectrical impedance, and an estimate is not a lab measurement. The readings shift with your hydration, your last meal, and the time of day, because BIA is reading your body water as much as anything else. That is precisely why a single number means very little, while the weekly trend means a lot.
A few practical rules follow from that. Weigh under the same conditions each time, ideally first thing in the morning after using the washroom and before eating or drinking. Judge direction over weeks rather than day-to-day wobble. Do not compare your numbers with a friend's different device, since the algorithms vary. And treat readings like visceral fat and metabolic age as useful indicators to track rather than precise clinical results. Used this way, the estimates are genuinely helpful. Read literally to the decimal point, they will only frustrate you.
Where FitAmplify fits
This is exactly the gap FitAmplify is built to close. The smart scale reads 56+ metrics with 8-point BIA, but the more important part is the free app, which turns that wall of numbers into plain-language trends and scores you can actually act on. A raw BMR figure is easy to ignore. A clear note that your muscle is holding steady while your visceral fat trends down is something you can feel good about and build on.
And because a number is always stronger with a person behind it, a real dietitian or coach can read your metrics together and tell you the one thing worth changing next, rather than leaving you to interpret a dashboard alone. If you would like someone to walk through your numbers with you, you can book a free 20-minute consultation. FitAmplify is a wellness tool, so for anything medical, your healthcare provider stays in the lead.
Frequently asked questions
What do smart scale metrics actually mean?
They break your weight into what it is made of. Muscle mass is your lean tissue, visceral fat is the riskier fat around your organs, and BMR is the energy you burn at rest. Read together, they explain far more about your health than the weight number alone ever could.
What is a good muscle mass reading on a smart scale?
There is no single target, because healthy muscle mass depends on your height, sex, and training history. The useful signal is your own trend over time. Steady or gradually rising muscle mass, especially while you are dieting or getting older, is the sign to look for.
What is a healthy visceral fat level?
Lower is generally better, and most scales flag a healthy versus high band on their rating. Since a scale estimates rather than measures visceral fat, treat the rating as a trend to lower over time, and discuss a persistently high reading with a healthcare professional.
What does BMR tell me, and should I eat that many calories?
BMR is roughly the calories you burn at complete rest, about 60 to 75% of your daily total. It is a baseline, not a target. Your actual needs are higher once activity is added, so use BMR as a realistic starting point rather than a strict number of calories to eat.
Are smart scale metrics accurate?
For tracking change, they are useful. They are BIA estimates, so a single reading can be off, but the weekly trend is dependable when you measure consistently. Muscle mass tends to be one of the stronger readings, while visceral fat is an estimate to track rather than a precise measure.
Which metric should I focus on first?
Start with the one tied to your goal. Building or protecting muscle? Watch muscle mass and BMR. Worried about health risk? Watch visceral fat. Trying to lose fat without losing muscle? Watch all three together and read the trend over weeks, not days.
Read your numbers, then act on them
The numbers on your scale are not decoration. Muscle mass, visceral fat, and BMR tell you what your weight is made of and how your metabolism is behaving, which is the information you actually need to make a change worth making. Track 56+ metrics with the FitAmplify scale and app, watch the trends that matter rather than the daily wobble, and book a free consultation with a real coach or dietitian who can turn the dashboard into a plan.
FitAmplify is a wellness product and is not a medical device. It is not intended to diagnose, treat, cure, or prevent any disease. BIA readings are for general wellness tracking, not diagnosis. Always consult a qualified healthcare professional regarding any medical concern.
References
1. Taking Aim at Belly Fat. Harvard Health Publishing, Harvard Medical School. https://www.health.harvard.edu/newsletter_article/taking-aim-at-belly-fat
2. Preserve your muscle mass. Harvard Health Publishing, Harvard Medical School. https://www.health.harvard.edu/staying-healthy/preserve-your-muscle-mass
3. Resting Metabolic Rate: How to Calculate and Improve Yours. National Academy of Sports Medicine (NASM). https://blog.nasm.org/nutrition/resting-metabolic-rate-how-to-calculate-and-improve-yours
4. Bioelectric Impedance Analysis (method overview and limitations). MRC Epidemiology Unit Measurement Toolkit, University of Cambridge. https://www.measurement-toolkit.org/anthropometry/objective-methods/bioelectric-impedence-analysis
5. Concordance between muscle mass assessed by bioelectrical impedance analysis and by dual-energy X-ray absorptiometry. BMC Musculoskeletal Disorders (2015). https://link.springer.com/article/10.1186/s12891-015-0510-9