What To Do With Smart Scale Data: Turn Body Trends Into a Weekly Plan
Your Smart Scale Numbers Are Trending. Now What? Turning Body Data Into a Weekly Plan

You stepped on the scale, the app synced 56+ numbers, and the lines are finally starting to move. So what to do with smart scale data once you can actually see a trend? The short version: stop reacting to single readings, watch the weekly direction of a few key metrics, and change one thing at a time. This guide shows you how to turn that body data into a simple weekly plan you can follow, without a spreadsheet obsession or a medical degree.
Key takeaways
• A single reading is noise. Body weight can swing 2 to 3 lb in a day from water, sodium, and food, so the weekly average is the number that matters.
• Watch direction, not perfection. Body fat trending down while muscle holds or rises is a win, even when the scale barely moves.
• Act on four or five metrics, not fifty: your weight trend, body fat %, muscle mass, visceral fat, and body water.
• Change one lever a week (food, training, sleep, or hydration), then re-scan and see if the trend actually moved.
• Aim for realistic weekly change (roughly 1 to 2 lb for fat loss, and slow muscle gain), and loop in a real coach or dietitian when the data stalls.
In this article
Why one reading tells you almost nothing
What to do with smart scale data: a simple weekly system
The four or five numbers worth acting on
Read the direction, not the dot
Turn the trend into a weekly plan
Realistic weekly targets, so you do not panic
Common mistakes when acting on scale data
Where a real expert changes the picture
At a glance: what a 2 to 4 week trend is probably telling you
Metric | A helpful trend looks like | Check this first if it stalls |
Weight (7-day average) | A slow drift toward your goal | Portion sizes, weekend eating, daily steps |
Body fat % | A gradual decline, or holding at a healthy level | Calorie intake, protein, activity |
Muscle mass | Holding steady or slowly rising | Protein intake, resistance training, sleep |
Visceral fat | A slow decrease over weeks | Sleep, alcohol, stress, waist habits |
Body water | Steady, without wild day-to-day swings | Hydration and weigh-in timing |
Table 1. A quick read on the trends that matter. General guidance for wellness tracking, not a diagnostic tool. Source: FitAmplify.
Why one reading tells you almost nothing
Here is the trap almost everyone falls into. You weigh in, the number is up a pound from yesterday, and your whole day sours. The problem is that a single reading is mostly noise. For someone in a healthy weight range, daily weight commonly moves within a window of about 5 to 6 pounds, roughly 2 to 3 pounds in either direction, driven by water, sodium, carbohydrates, and whatever is still moving through your system.
Bioelectrical impedance analysis, the technology inside a smart body-composition scale, works by sending a gentle signal through your body and reading how easily it passes. Because that signal is strongly affected by body water, your readings shift with hydration, a recent meal, and even a hard workout. Research on BIA reliability shows this day-to-day biological variation is real, which is exactly why a jump overnight is almost never fat.
That is not a flaw in the scale. It is physics, and once you understand it, the fix is simple: weigh consistently and let the app average it out. FitAmplify's own guidance is to weigh first thing in the morning, before eating or drinking, after using the bathroom, and to read weekly trends rather than daily numbers. When you do that, the noise cancels and the real signal appears.
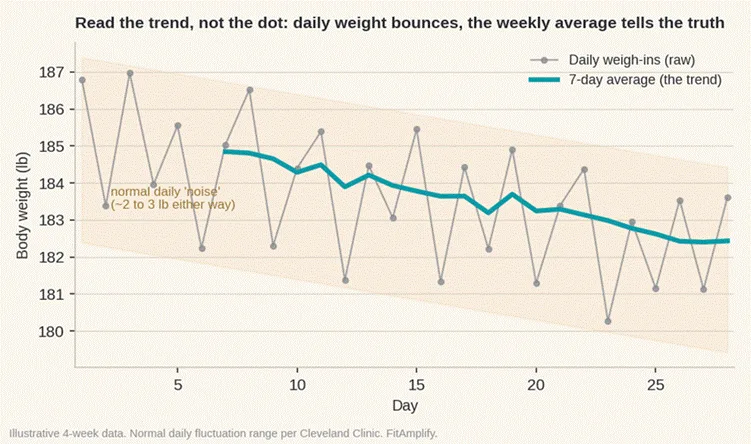
Figure 1. The daily line jumps around; the 7-day average shows the real direction.
What to do with smart scale data: a simple weekly system
You do not need to act on every one of your 56+ metrics, and you definitely do not need to react to every reading. A workable system has three moves, and it runs on a weekly rhythm.
1. Measure consistently. Weigh most days, same time, same conditions, and let the app collect the data. One tap syncs your scan over Bluetooth, so you are not typing numbers into anything.
2. Review once a week. Look at the 7-day average for weight and the 4-week direction of a few key metrics. You are asking one question: which way is this trending?
3. Adjust one lever, then improve. If a trend is stuck, change one thing (food, training, sleep, or hydration), hold it for a week or two, and re-scan to see if the needle moved.
This is the loop FitAmplify is built around: Measure, Review, Adjust, Improve. It keeps you from the two most common failure modes, which are doing nothing because the daily number is confusing, and changing everything at once so you can never tell what worked.
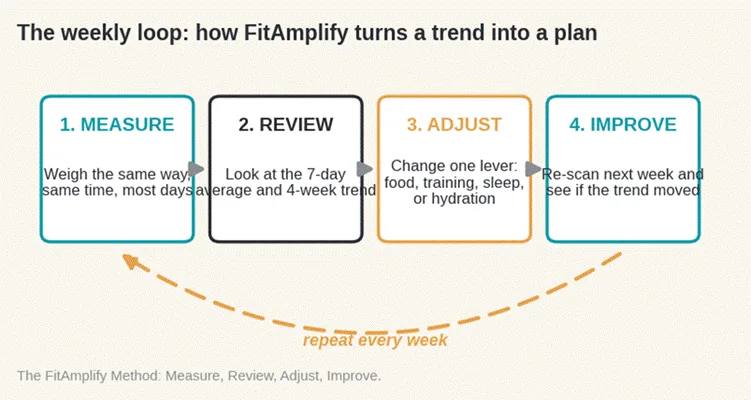
Figure 2. The weekly loop. Small, testable changes beat dramatic overhauls.
The four or five numbers worth acting on
Your dashboard reports dozens of metrics, and they are all interesting. For weekly decisions, though, most of the story lives in a handful. Here is what each one means and what a healthy trend looks like.
Metric | What it is | General reference | A good trend looks like |
Weight (7-day avg) | Total body mass, smoothed over a week | Depends on height and build; use the trend, not one day | Slow drift toward your goal |
Body fat % | The share of your weight that is fat | Average nonathlete is about 18 to 24% for men and 25 to 31% for women (ACE) | Gradual decline, or holding at a healthy level |
Muscle mass | Lean tissue that drives strength and metabolism | No single target; track your own baseline | Holding steady or slowly rising |
Visceral fat | Fat stored around the abdominal organs | Lower is generally better for long-term health | A slow decline over weeks to months |
Body water | Water as a share of body weight | Varies with hydration, sex, and how lean you are | Steady, no wild swings |
Table 2. The metrics that carry most of the weekly signal. Body fat reference ranges from the American Council on Exercise (ACE). General wellness guidance, not a medical assessment.
A quick note on body fat percentage. The ranges above are averages for the general population, not targets you must hit. Where you sit depends on age, sex, and goals, and a registered dietitian or coach can help you set a range that is realistic for your body. The point of tracking it is the direction over time, not a single label.
Read the direction, not the dot
This is where body-composition data earns its keep. A basic scale gives you one number, so it can only tell you if you are heavier or lighter. It cannot tell you whether you lost fat, lost muscle, or just used the bathroom. Body-composition tracking separates those, and that changes how you read progress.
The clearest example is body recomposition, where you lose fat and build muscle at the same time. On the scale, your weight can sit almost flat for weeks. Look at the components, though, and body fat is trending down while muscle is trending up. That is real progress a basic scale would completely hide.
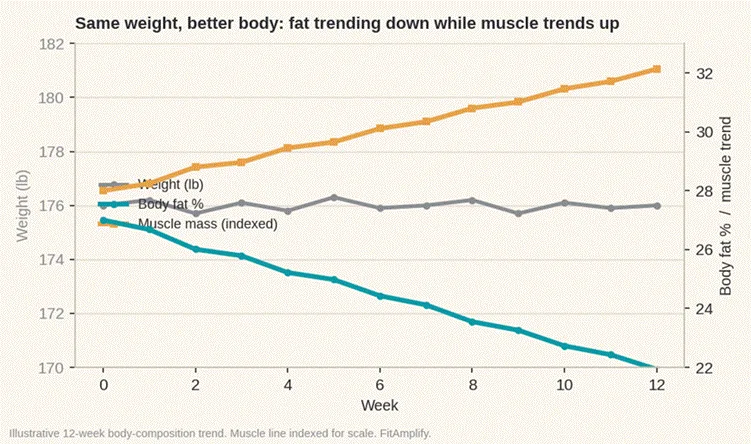
Figure 3. Same weight, better body. The scale is flat; the composition is improving.
Once you can see components, a few common patterns tell you what to do next:
• Weight down, fat down, muscle steady. Healthy fat loss. Keep going.
• Weight flat, fat down, muscle up. Recomposition. Do not let the flat scale discourage you.
• Weight dropping fast, muscle slipping. You may be losing the wrong thing. Ease the deficit, lift, and raise protein.
• Weight up, muscle up, fat steady. You are adding muscle. Expected if you are training hard and eating enough.
Turn the trend into a weekly plan
Reading the trend is half the job. The other half is knowing which single lever to pull. Resist the urge to change your diet, your training, and your sleep all in the same week. Pick the most likely cause, adjust it, and let the data tell you if you were right. The table below maps common 4-week patterns to a sensible first move.
If your 4-week trend shows | Likely cause | First adjustment to try |
Fat loss stalled, weight flat 2 to 3 weeks | Intake has crept up, or your body has adjusted | Tighten portions slightly or add daily steps, then recheck in 1 to 2 weeks |
Weight dropping but muscle slipping | Deficit too aggressive, or protein too low | Raise protein and add resistance training; ease the size of the deficit |
Big overnight jumps, no real trend | Water, sodium, and carbs, not fat | Ignore the spike; keep weighing and watch the weekly average |
Visceral fat not budging | Sleep, alcohol, or chronic stress | Protect your sleep and moderate alcohol before cutting calories further |
Body water swinging a lot | Inconsistent weigh-in timing or hydration | Standardize your weigh-in and keep hydration steady day to day |
Table 3. A starting point, not a prescription. Change one lever, then re-scan. For persistent stalls or any medical concern, talk to a qualified professional.
Two of these levers deserve a closer look because people usually underrate them. The first is protein. When you are in a calorie deficit, protein is what protects your muscle, and higher protein intakes are consistently linked with holding on to more lean mass during weight loss. A common evidence-based target is around 1.6 grams per kilogram of body weight per day, though the right number for you depends on your size and training.
The second is sleep, which quietly decides how your weight loss gets spent. In a controlled study, dieters who slept 5.5 hours lost 55% less fat than when they slept 8.5 hours, and they lost more lean mass instead. Same diet, very different result, decided largely by rest. If your fat trend is stuck and your sleep is short, that is often the lever to pull first.
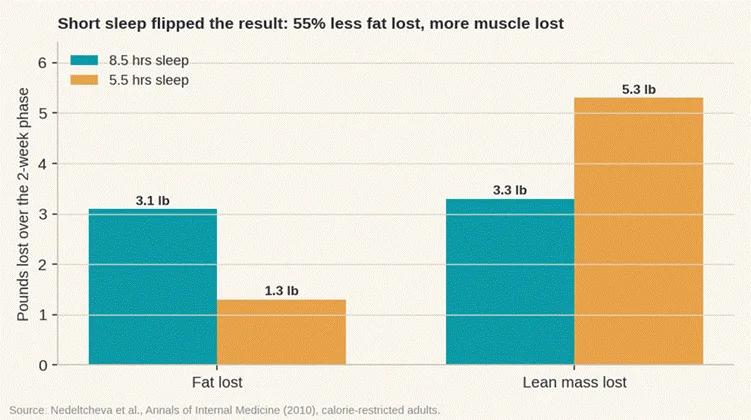
Figure 4. When sleep gets short, fat loss stalls and muscle loss climbs.
Realistic weekly targets, so you do not panic
A lot of frustration comes from expecting a week to do a month's work. Progress in body composition is slow by design, and slow is what tends to stick. The table below sets expectations so a normal week does not read as failure.
Metric | Realistic weekly change | Treat with caution if |
Weight (fat loss) | About 0.5 to 1% of body weight, often near 1 to 2 lb for many adults | You are dropping fast for weeks and muscle is falling too |
Body fat % | Small, often a fraction of a point week to week | You expect a visible drop every single week |
Muscle mass | Slow; often a fraction of a pound per month, faster for beginners | A large overnight 'gain' appears (usually water or food) |
Visceral fat | A gradual decline over months, not weeks | You judge it on a single reading |
Daily weight noise | 2 to 3 lb up or down is normal | One reading changes your whole plan |
Table 4. Healthy pacing. Weight-loss rate guidance from the CDC; normal daily fluctuation from Cleveland Clinic. Individual results vary.
The CDC notes that people who lose weight gradually, at about 1 to 2 pounds a week, are more likely to keep it off than people who lose it faster. That is the whole case for patience. A trend that moves a little every week, sustained for months, beats a dramatic month you cannot repeat.
Common mistakes when acting on scale data
Even good data gets misused. These are the slip-ups that send people in circles.
• Weighing at random times. Morning, after coffee, after dinner, after a workout. You are measuring different states, so of course the numbers jump. Pick one time and stick to it.
• Changing everything at once. New diet, new program, and less sleep in the same week means you will never know which change moved the trend.
• Chasing the daily number. The daily reading is for logging, not for decisions. Decisions live in the weekly average.
• Ignoring muscle. If you only watch weight, you can celebrate a drop that was mostly muscle and water. Watch lean mass alongside fat.
• Treating a wellness reading as a diagnosis. BIA is excellent for tracking your own trends over time. It is not a medical test, and a number outside a general range is a prompt to talk to a professional, not a verdict.
Where a real expert changes the picture
Most smart scales hand you an algorithm. We hand you people. Data is only useful when someone can tell the difference between a genuine plateau and a tracking artifact, and that is where our expert team comes in. A real coach or dietitian looks at your actual scan history, spots the pattern behind the numbers, and tells you the one change worth making this week.
As Chandradip Ghosh, our Nutrition & Fitness Coach, puts it: "I don't guess. Every program I write starts from your body scan results." That is the difference between a dashboard and a plan. The scale shows you what is happening; a real expert who reads your data tells you what to do about it, and updates that plan as your body changes.
Frequently asked questions
What should I actually do with my smart scale data?
Use it to spot trends, then act on them once a week. Weigh consistently, look at the 7-day average and the 4-week direction of a few metrics (weight, body fat %, muscle mass, visceral fat, body water), and change one lever at a time. Then re-scan to see if the trend moved. Single readings are for logging, not decisions.
How often should I weigh in and check my metrics?
Weighing most days is fine, as long as you read the weekly average rather than each day's number. For the deeper body-composition metrics, a weekly review and a monthly zoom-out is plenty. Daily body fat or muscle numbers bounce with hydration, so checking them hourly will only stress you out.
My weight jumped up overnight. Did I gain fat?
Almost certainly not. Daily weight can move 2 to 3 lb in either direction from water, sodium, carbohydrates, and food still in your system. A pound of fat takes a real calorie surplus to build, which an overnight change cannot explain. Watch the weekly average and the spike will wash out.
The scale is flat but I look leaner. What is going on?
That is often body recomposition: you are losing fat and gaining muscle at roughly the same rate, so total weight barely changes. A basic scale hides this completely. Your body fat % trending down while muscle mass holds or rises is the proof, and it is a genuinely good result.
How long should I wait before changing my plan?
Give a change one to two weeks before judging it, since a single week is mostly noise. If a trend has been flat for two to three weeks, that is a reasonable signal to adjust one lever. Persistent stalls, especially with fatigue or other symptoms, are worth reviewing with a professional.
Are smart scale body-fat numbers accurate enough to act on?
For tracking your own trend over time, yes, as long as you measure under consistent conditions. BIA is affected by hydration and food, so it is better at showing your direction than at pinning down one perfect number. Treat it as a wellness tool, not a medical diagnosis.
References
1. Centers for Disease Control and Prevention (CDC). "Steps for Losing Weight."
2. Cleveland Clinic. "Why Does the Number on the Scale Change So Much?"
3. American Council on Exercise (ACE). "Body Fat Percentage Averages for Men and Women."
Wellness disclaimer: FitAmplify is a wellness product and is not a medical device. It is not intended to diagnose, treat, cure, or prevent any disease. Body-composition readings are for general wellness tracking, not medical diagnosis. Always consult a qualified healthcare professional regarding any medical concern.